LLM Serving Stack
An LLM inference stack, built layer by layer: an OpenAI-compatible gateway that mirrors how vLLM and TGI actually serve models.
An inference gateway that speaks the OpenAI API, queues and streams requests, and exposes the metrics that matter for serving — time to first token, tail latency, tokens per second, queue depth. It's backed locally by Ollama (Metal-accelerated on Apple Silicon) and swaps to a real GPU backend like vLLM or TGI by changing one env var; the API, metrics, and dashboards stay identical.
The point was to build the serving layer myself — the request scheduler, the streaming wire format, the observability — rather than treat it as a black box, so the moving parts of a production stack are legible end to end.
Architecture
client (curl / Python / OpenAI SDK)
        │
        ▼
┌────────────────────────────┐
│      FastAPI gateway        │  :8000
│  • OpenAI-compatible API    │
│  • async request queue      │  ← models vLLM continuous batching
│  • SSE streaming            │  ← same wire format as vLLM / TGI
│  • auth · rate limit · route│
│  • Prometheus /metrics      │  ← TTFT, p95, TPS, queue depth
└──────────────┬─────────────┘
               ▼
        Ollama backend  (Metal)  →  swappable: vLLM / TGI
               │
        Prometheus :9090  →  Grafana :3000  (provisioned)
How it maps to production
| Concept | vLLM / TGI | This project |
|---|---|---|
| OpenAI-compatible API | ✓ | ✓ |
| SSE streaming | ✓ | ✓ |
| Request queue | PagedAttention scheduler | asyncio.Semaphore |
| Time to first token | internal | Prometheus histogram |
| Tokens per second | internal | Prometheus histogram |
| Health + /metrics | ✓ | ✓ |
The stack
- GatewayOpenAI-compatible /v1/chat/completions with an async semaphore queue that models vLLM's continuous-batching scheduler, plus SSE streaming on the same wire format as vLLM / TGI.
- AuthAPI-key middleware on every request.
- Rate limitingPer-key requests-per-minute cap and a token budget.
- RoutingPrompt-complexity classification that selects the model to serve.
- TracingOpenTelemetry spans exported over OTLP (Jaeger / Tempo).
- ObservabilityPrometheus metrics — TTFT, latency p95, tokens/sec, queue depth — on a provisioned Grafana board.
- BenchmarkA four-scenario load test: sequential vs concurrent, sync vs streaming.
Usage
Drop-in OpenAI SDK — just point base_url at the gateway:
from openai import OpenAI

client = OpenAI(base_url="http://localhost:8000/v1", api_key="local")

for chunk in client.chat.completions.create(
    model="llama3.2:1b",
    messages=[{"role": "user", "content": "Explain GPU MIG in 2 sentences."}],
    stream=True,
):
    print(chunk.choices[0].delta.content or "", end="", flush=True)
Observability
Every request is instrumented; Prometheus scrapes the gateway every 5s and a provisioned Grafana board renders the serving signals with no manual setup.
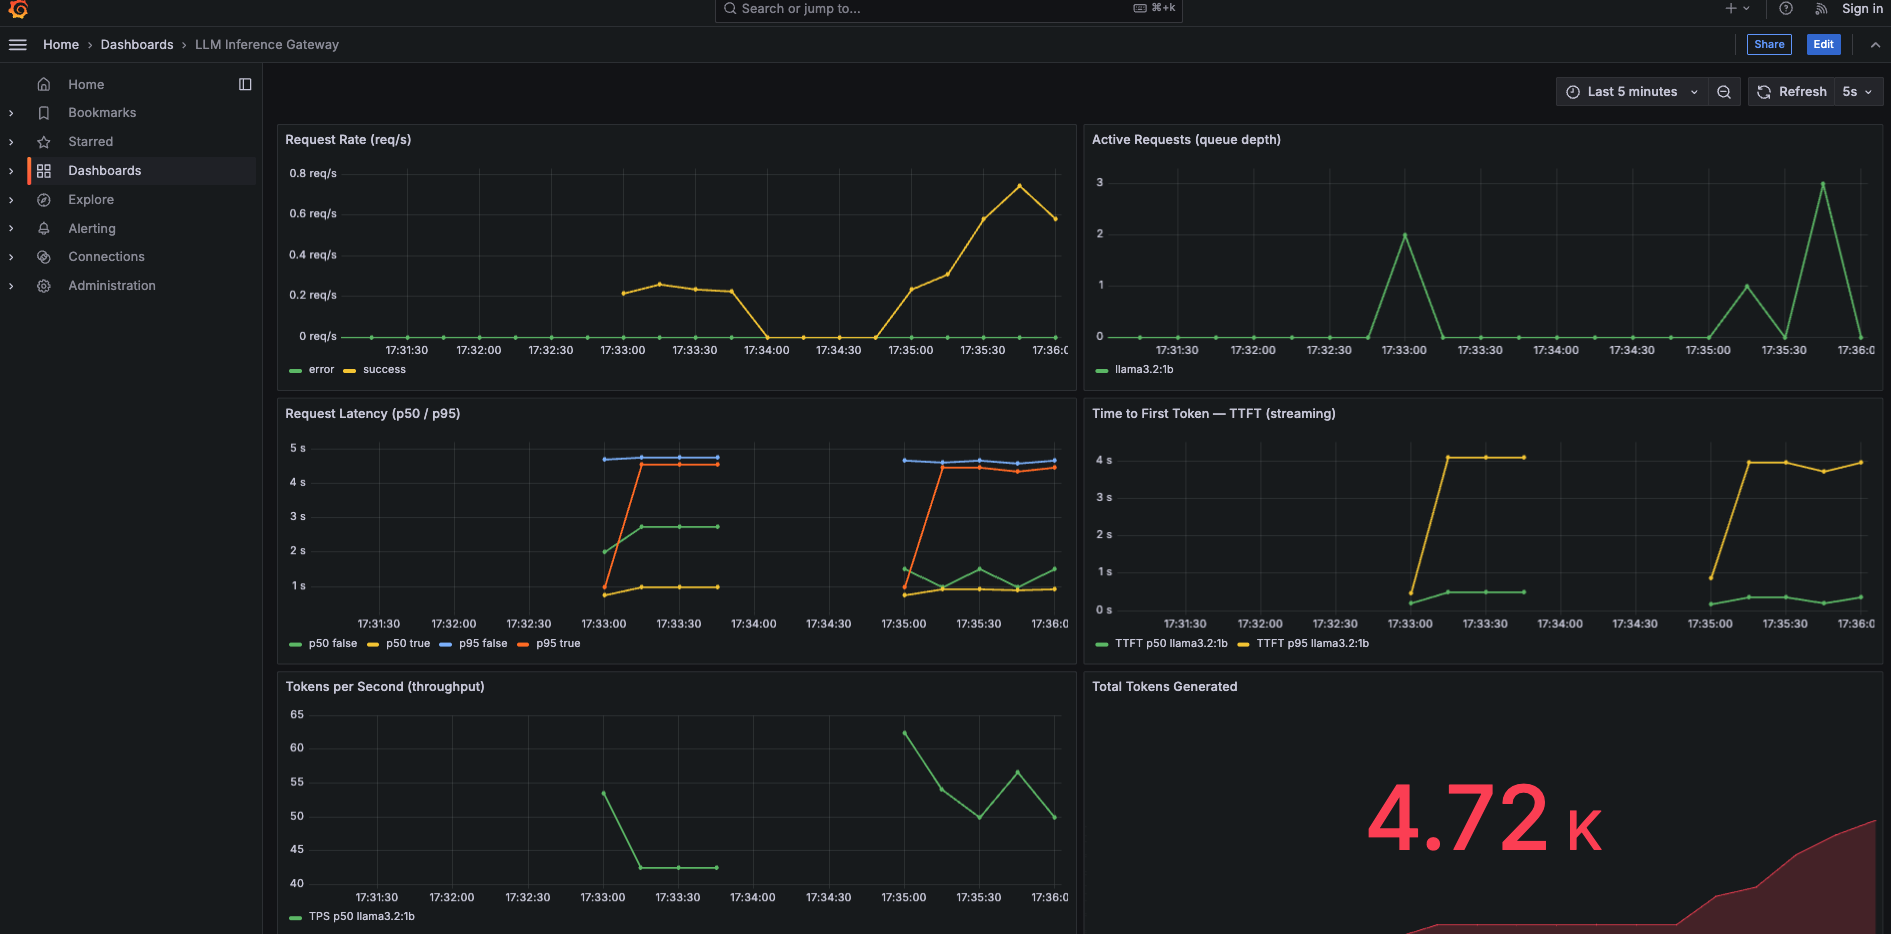
llm_requests_totalrequest rate by statusllm_active_requestslive queue depthllm_request_duration_secondsend-to-end latency (p50 / p95)llm_time_to_first_token_secondsTTFT — the key streaming UX metricllm_tokens_per_secondgeneration throughputllm_tokens_generated_totalcumulative tokens