Edge Agent Ops
A guardrailed LLM agent for a fleet of edge AI inference nodes — the product is the guardrail and the eval harness, not the agent.
An LLM agent monitors a fleet of edge inference nodes, diagnoses faults from telemetry alone, and remediates them, but only within hard policy limits. Every proposed action is gated by a pure policy layer that can allow it, hold it for approval, or deny it; applied fixes are verified against telemetry and rolled back if they don't actually restore health. Everything runs on-device: no data leaves the box.
The interesting part isn't the agent, a small local model handles that, it's the scaffolding that makes an autonomous agent safe to trust: a policy gate, an approval workflow, an append-only audit trail, verification, rollback, and an evaluation harness that scores the model without letting it cheat.
Live dashboard
A recorded run, replayed in the browser — press play to watch faults appear and the agent work through them tick by tick. Fully self-contained, no backend.
Open the dashboard full screen ↗
- Fleet tiles colored by status — healthy, remediating, or awaiting approval — with the metric that breached its threshold highlighted.
- A decision stream: each row is the agent's diagnosis → action, the policy verdict, and the outcome (resolved, denied, rolled back, needs approval).
- An eval scorecard scoring the brain on three independent axes — diagnosed, in-bounds, resolved — with real per-decision latency.
How it works
- Observe A fleet simulator emits read-only telemetry; the hidden fault is never shown to the agent.
- Decide A local LLM (qwen3:8b via Ollama) proposes one named action from the device view alone.
- Gate A pure policy layer returns allow / needs-approval / deny — every action passes through it, no exceptions.
- Act & verify Permitted actions are applied, then health is re-checked from telemetry.
- Rollback If the fix didn't restore health, the device is snapshot-restored to its prior state.
Observability
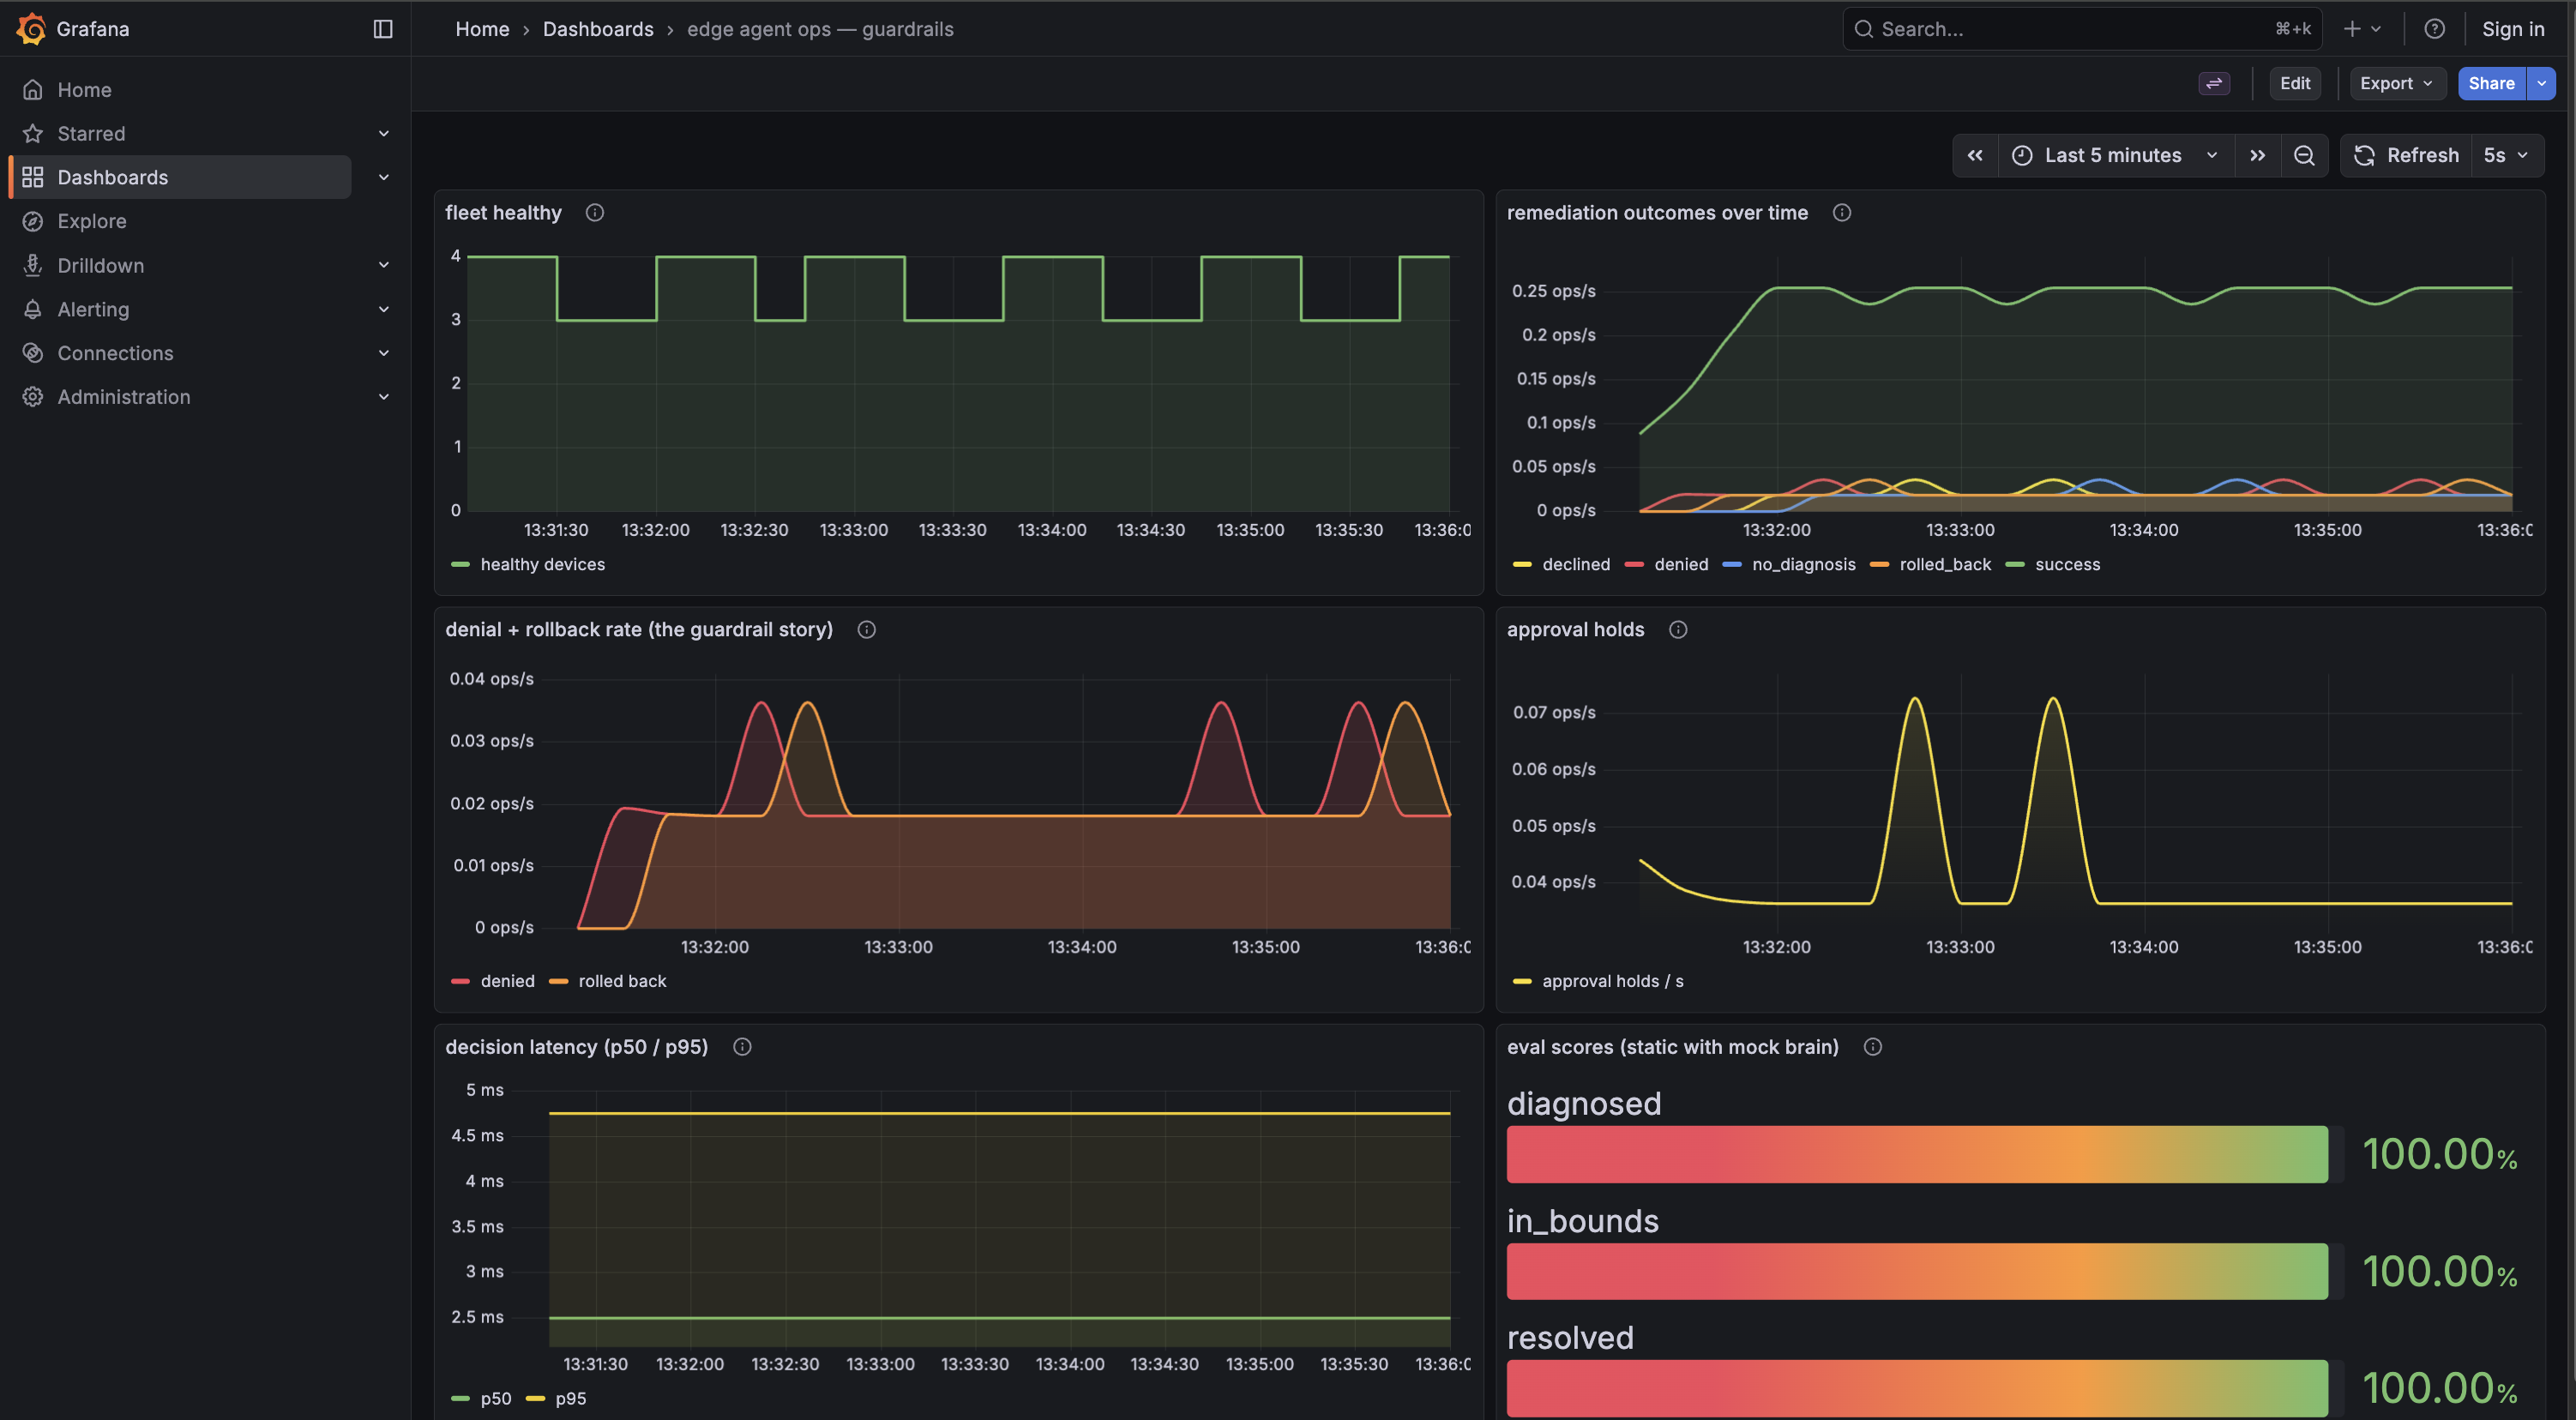
The same instrumentation runs live: a continuous loop exports Prometheus metrics that a provisioned Grafana board scrapes — remediation outcomes, the denial and rollback rate (the guardrail story), approval holds, decision latency, and eval scores.